Scientific Data Workspace is a platform that provides scientists with a set of tools to streamline the handling and organization of data between various informatics systems.
CONTRIBUTION
User Experience
UI Design
Branding
Art Direction
YEAR
2022–2023
About the project
Disclaimer
Because of non-disclosure agreements, I cannot go into full detail of everything delivered and developed for this project online. I would be happy to chat more in person if you contact me.
The Scientific Data Workspace was designed for a bioinformatics and scientific consulting company that at the time had no customer-facing UI for their main data processing services. The vision was that the Workspace would be the place where customer teams could have access to various data processing tools, and would act as a boilerplate way to incorporate new company services as needed.
The primary tool we were tasked with introducing to the Workspace was the company's assay data transformation process, which at the time was accomplished solely via command line — an extremely time-consuming and manual experience for customer scientists. The challenge was to design a solution that would allow for a more automated and intuitive experience for scientists to more easily ingest and format reports for sharing research insights on common platforms in the industry.
In order to achieve a solution, my responsibilities revolved around the following challenges:
01 | Understand the primary concepts & user audience
Understanding the user audience and its goals, along with understanding any existing tech and constraints was key to informing a solution.
02 | Craft a framework for the Workspace & assay tool
Client developers needed basic patterns to work with so as the Workspace moved into implementation they could be reused to fill in the blanks for areas of the product not covered in the UX scope (admin views, configuration screens, etc.).
03 | Design & handoff deliverables for implementation
I designed patterns for key screens and high-level workflows so they had enough to work with and could "fill in the blanks" by reusing patterns.
01 | Understanding primary concepts & audience
I was responsible for understanding the existing assay processes for internal employees and customer end-users. This understanding was crucial in order to propose solutions while stakeholders were still trying to determine what was feasible and needed for MVP. Over a two-week period, I met with SMEs and technical personnel in order to create a wholistic view for a more streamlined experience for both employees and customers.
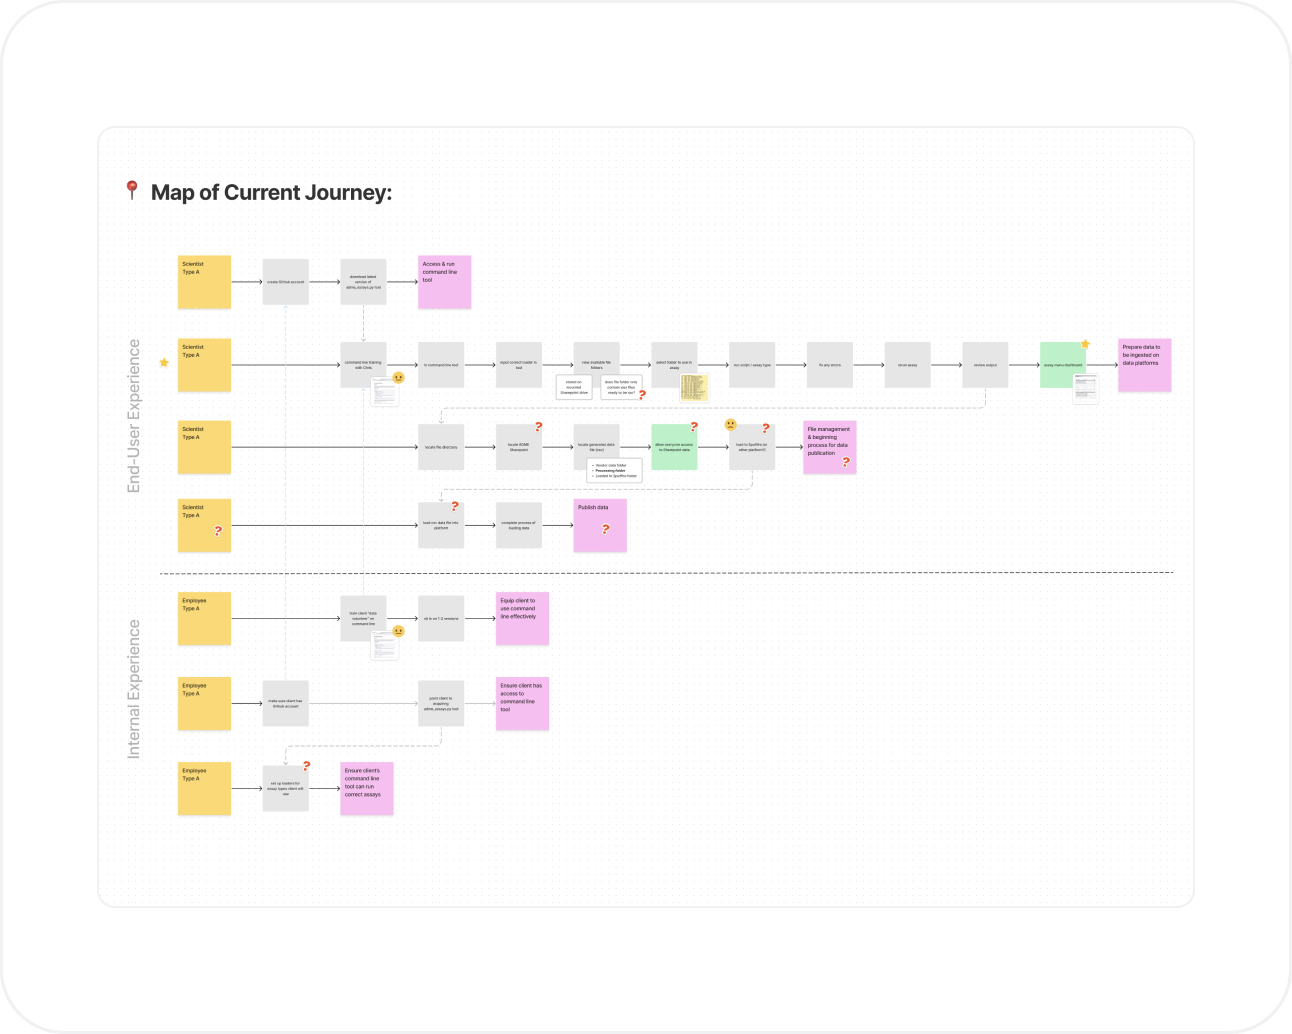
⬑ Existing Processes: I made a services blueprint to track current processes; highlight major pain points; and identify where a UI would be critical to improving the overall experience.
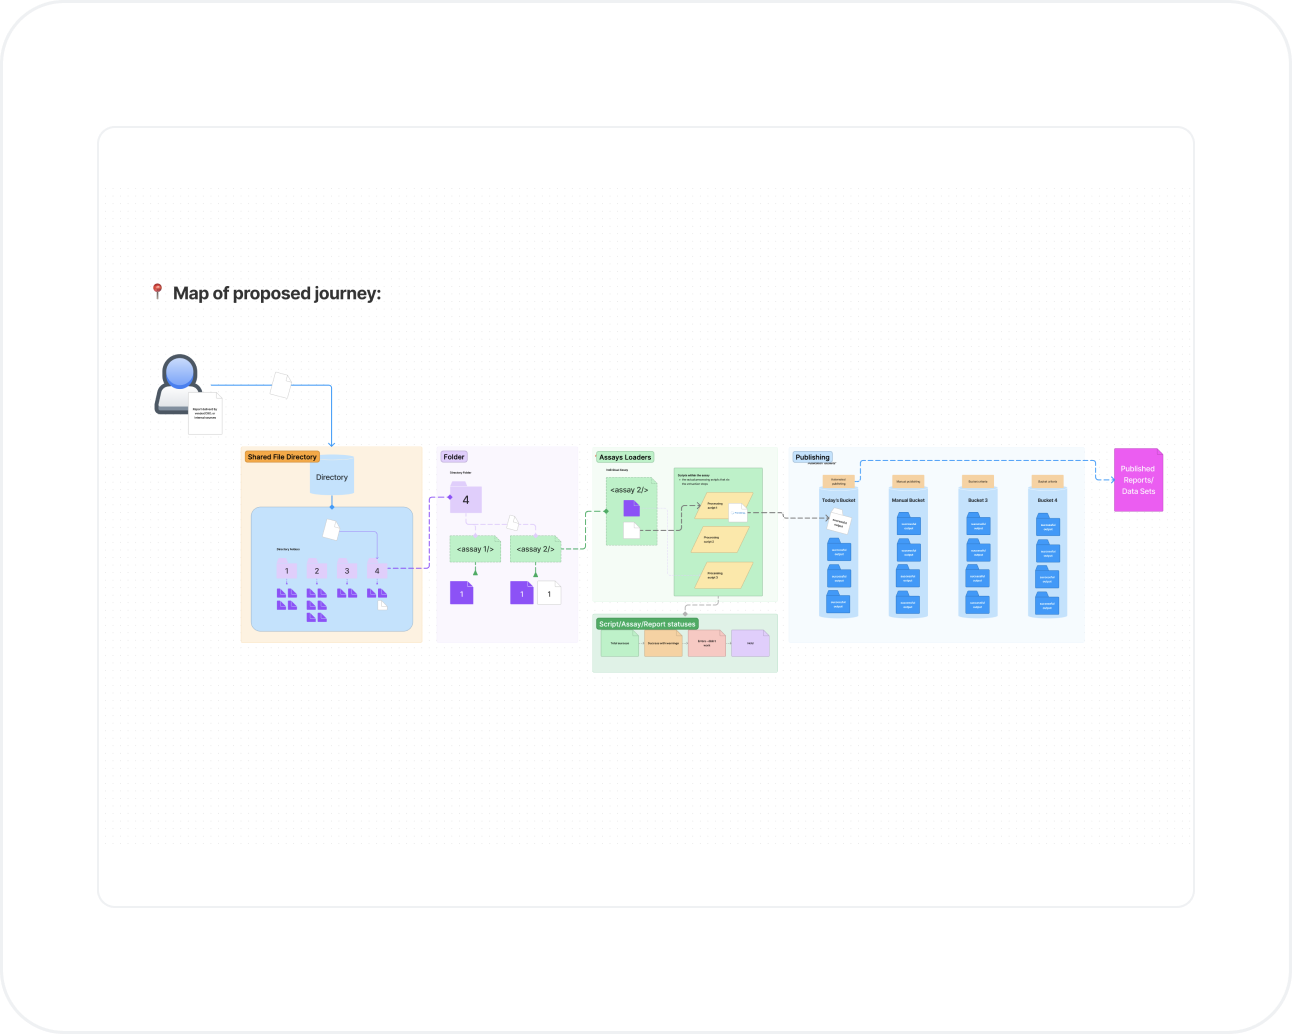
⬑ Potential Solution: Through many back and forth conversations, a high level solution was found and visualized in order to inform a UI and technical constraints.
⬑ Personas: After identifying five key scientist users for the assay tool, the focus revolved around the needs of what was considered the most crucial user above.
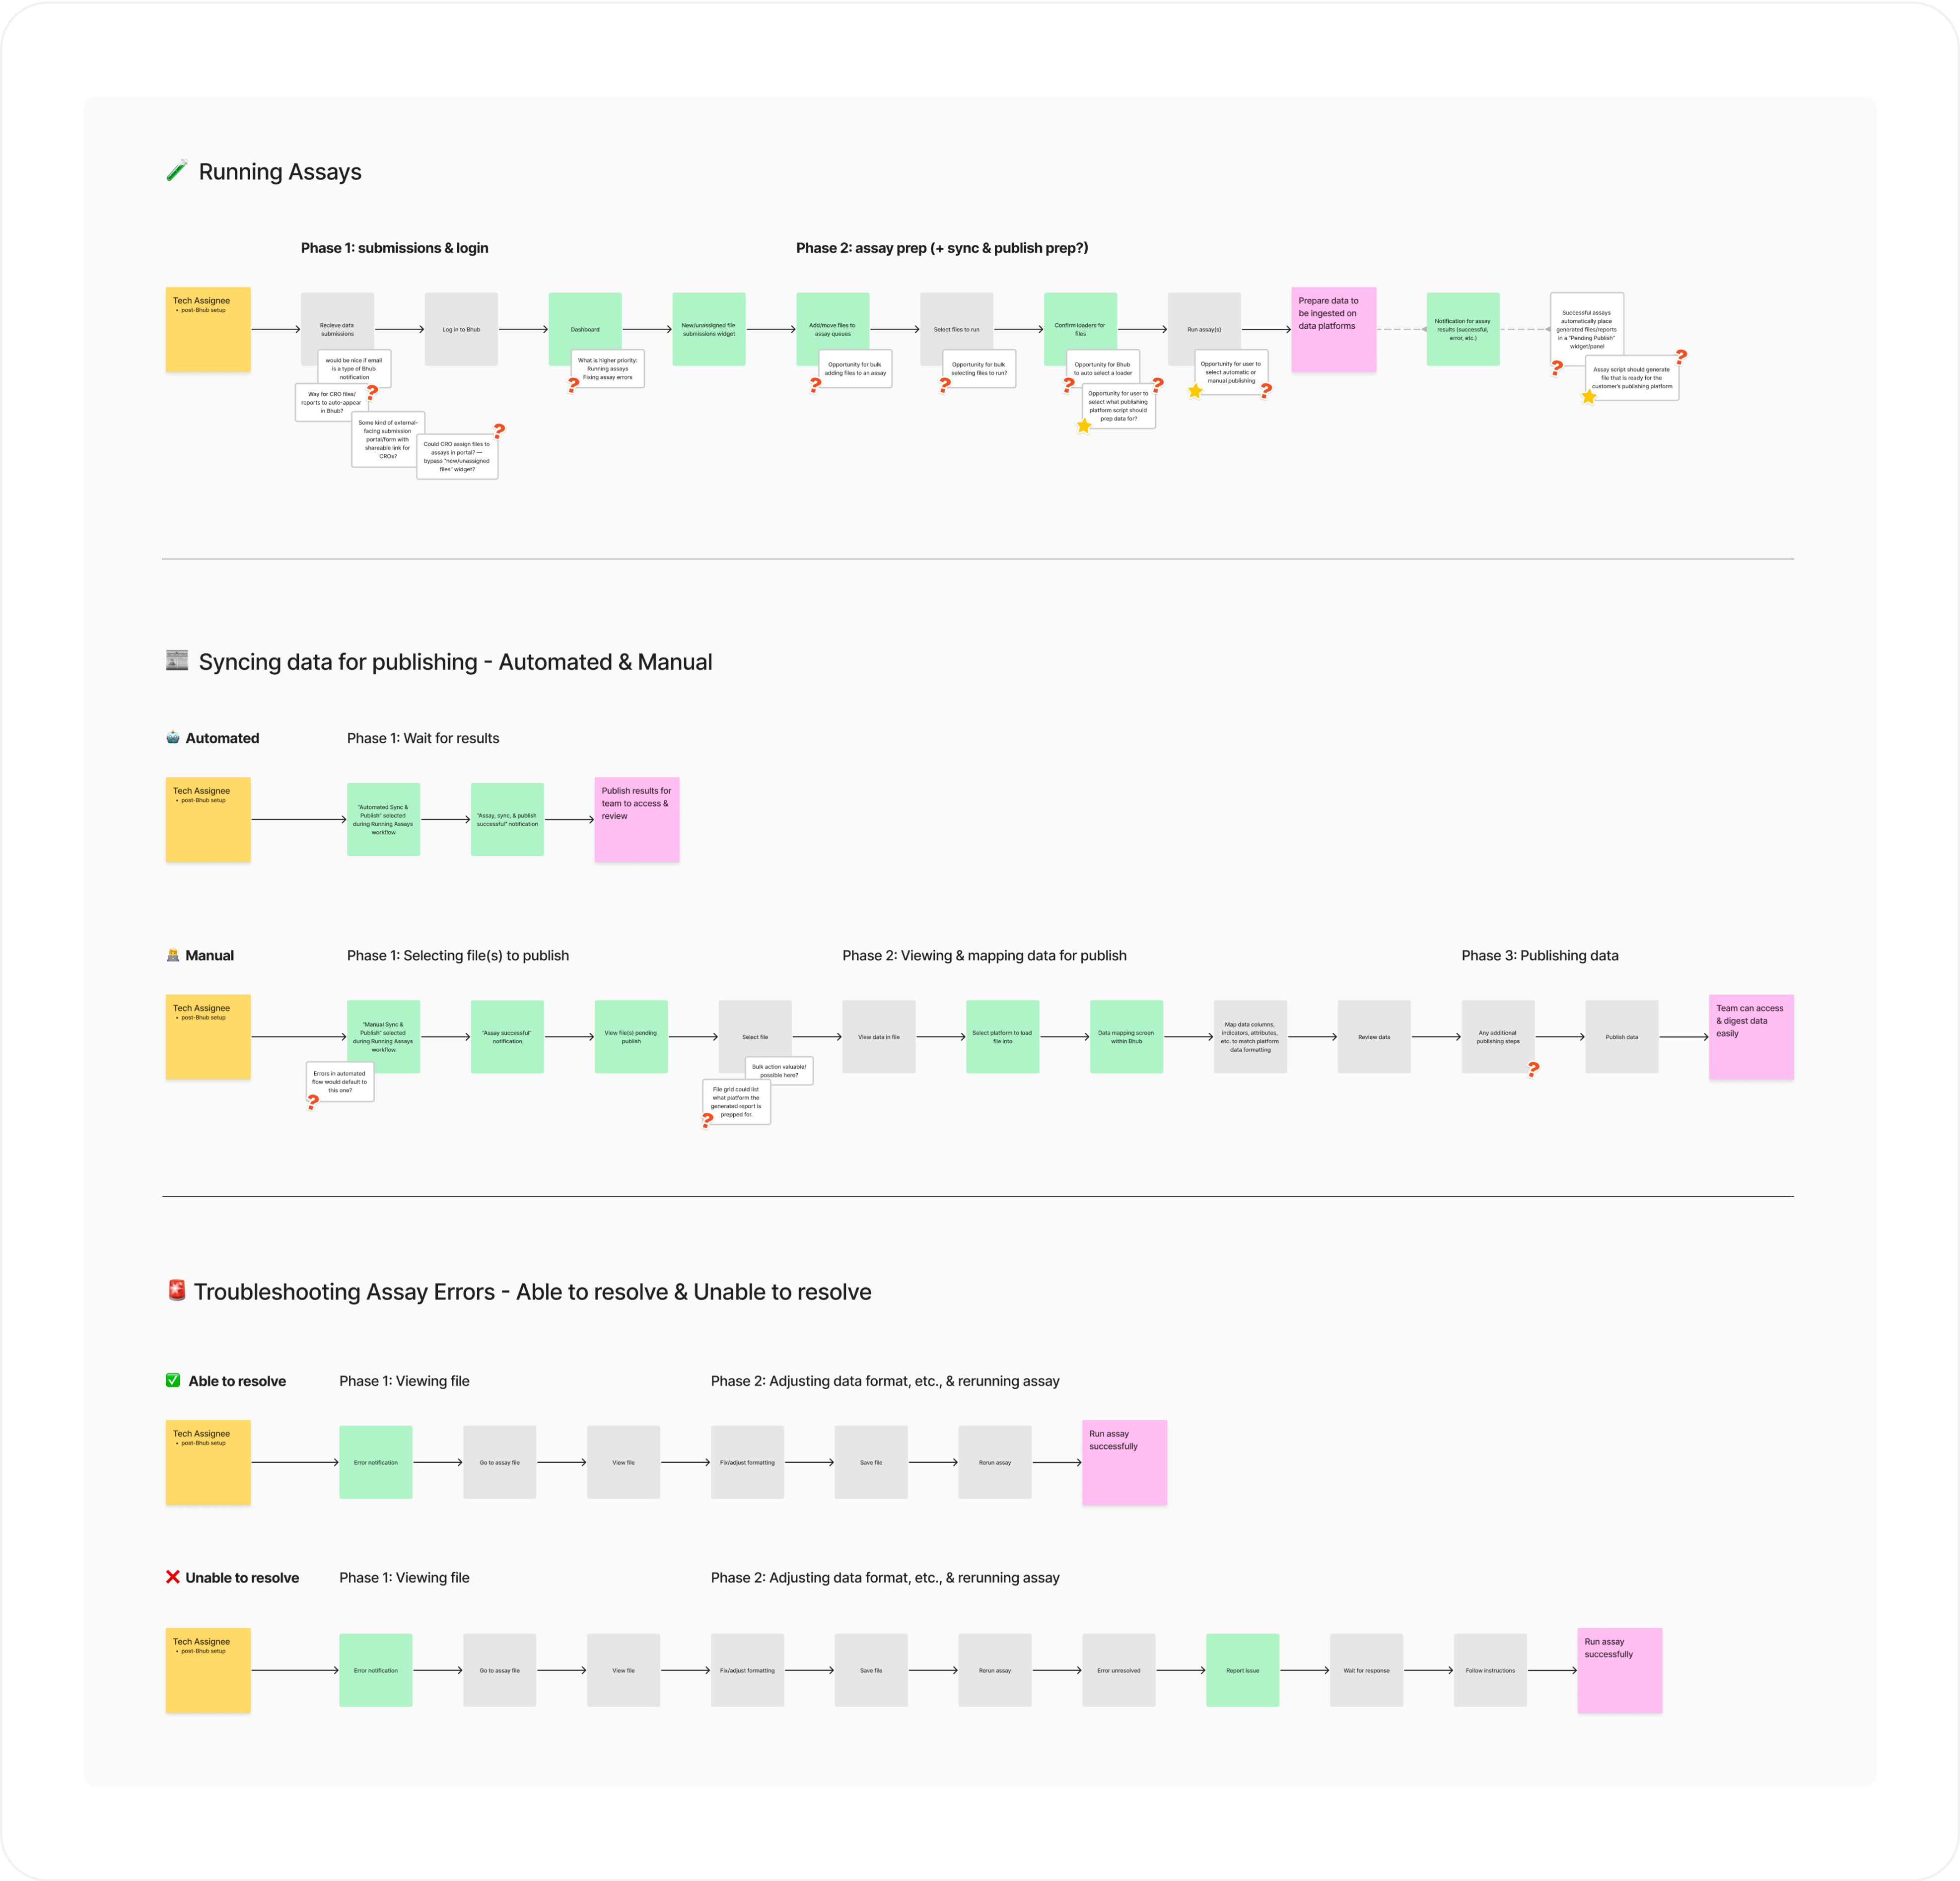
⬑ Primary Workflows: High-level Technology Assignee journeys were mapped in FigJam to allow for collaborative thinkng while determining the best UI flows.
02 | Crafting a framework
Due to some project restrictions, we did not delve into what the initial customer setup and configuration would be depending on what tools and modules were needed. Instead, we were only required to provide a framework of scalable and reusable patterns so the client developer team could "fill in the blanks" as needed. Admin view needs had not been fully determined at the time of the project.
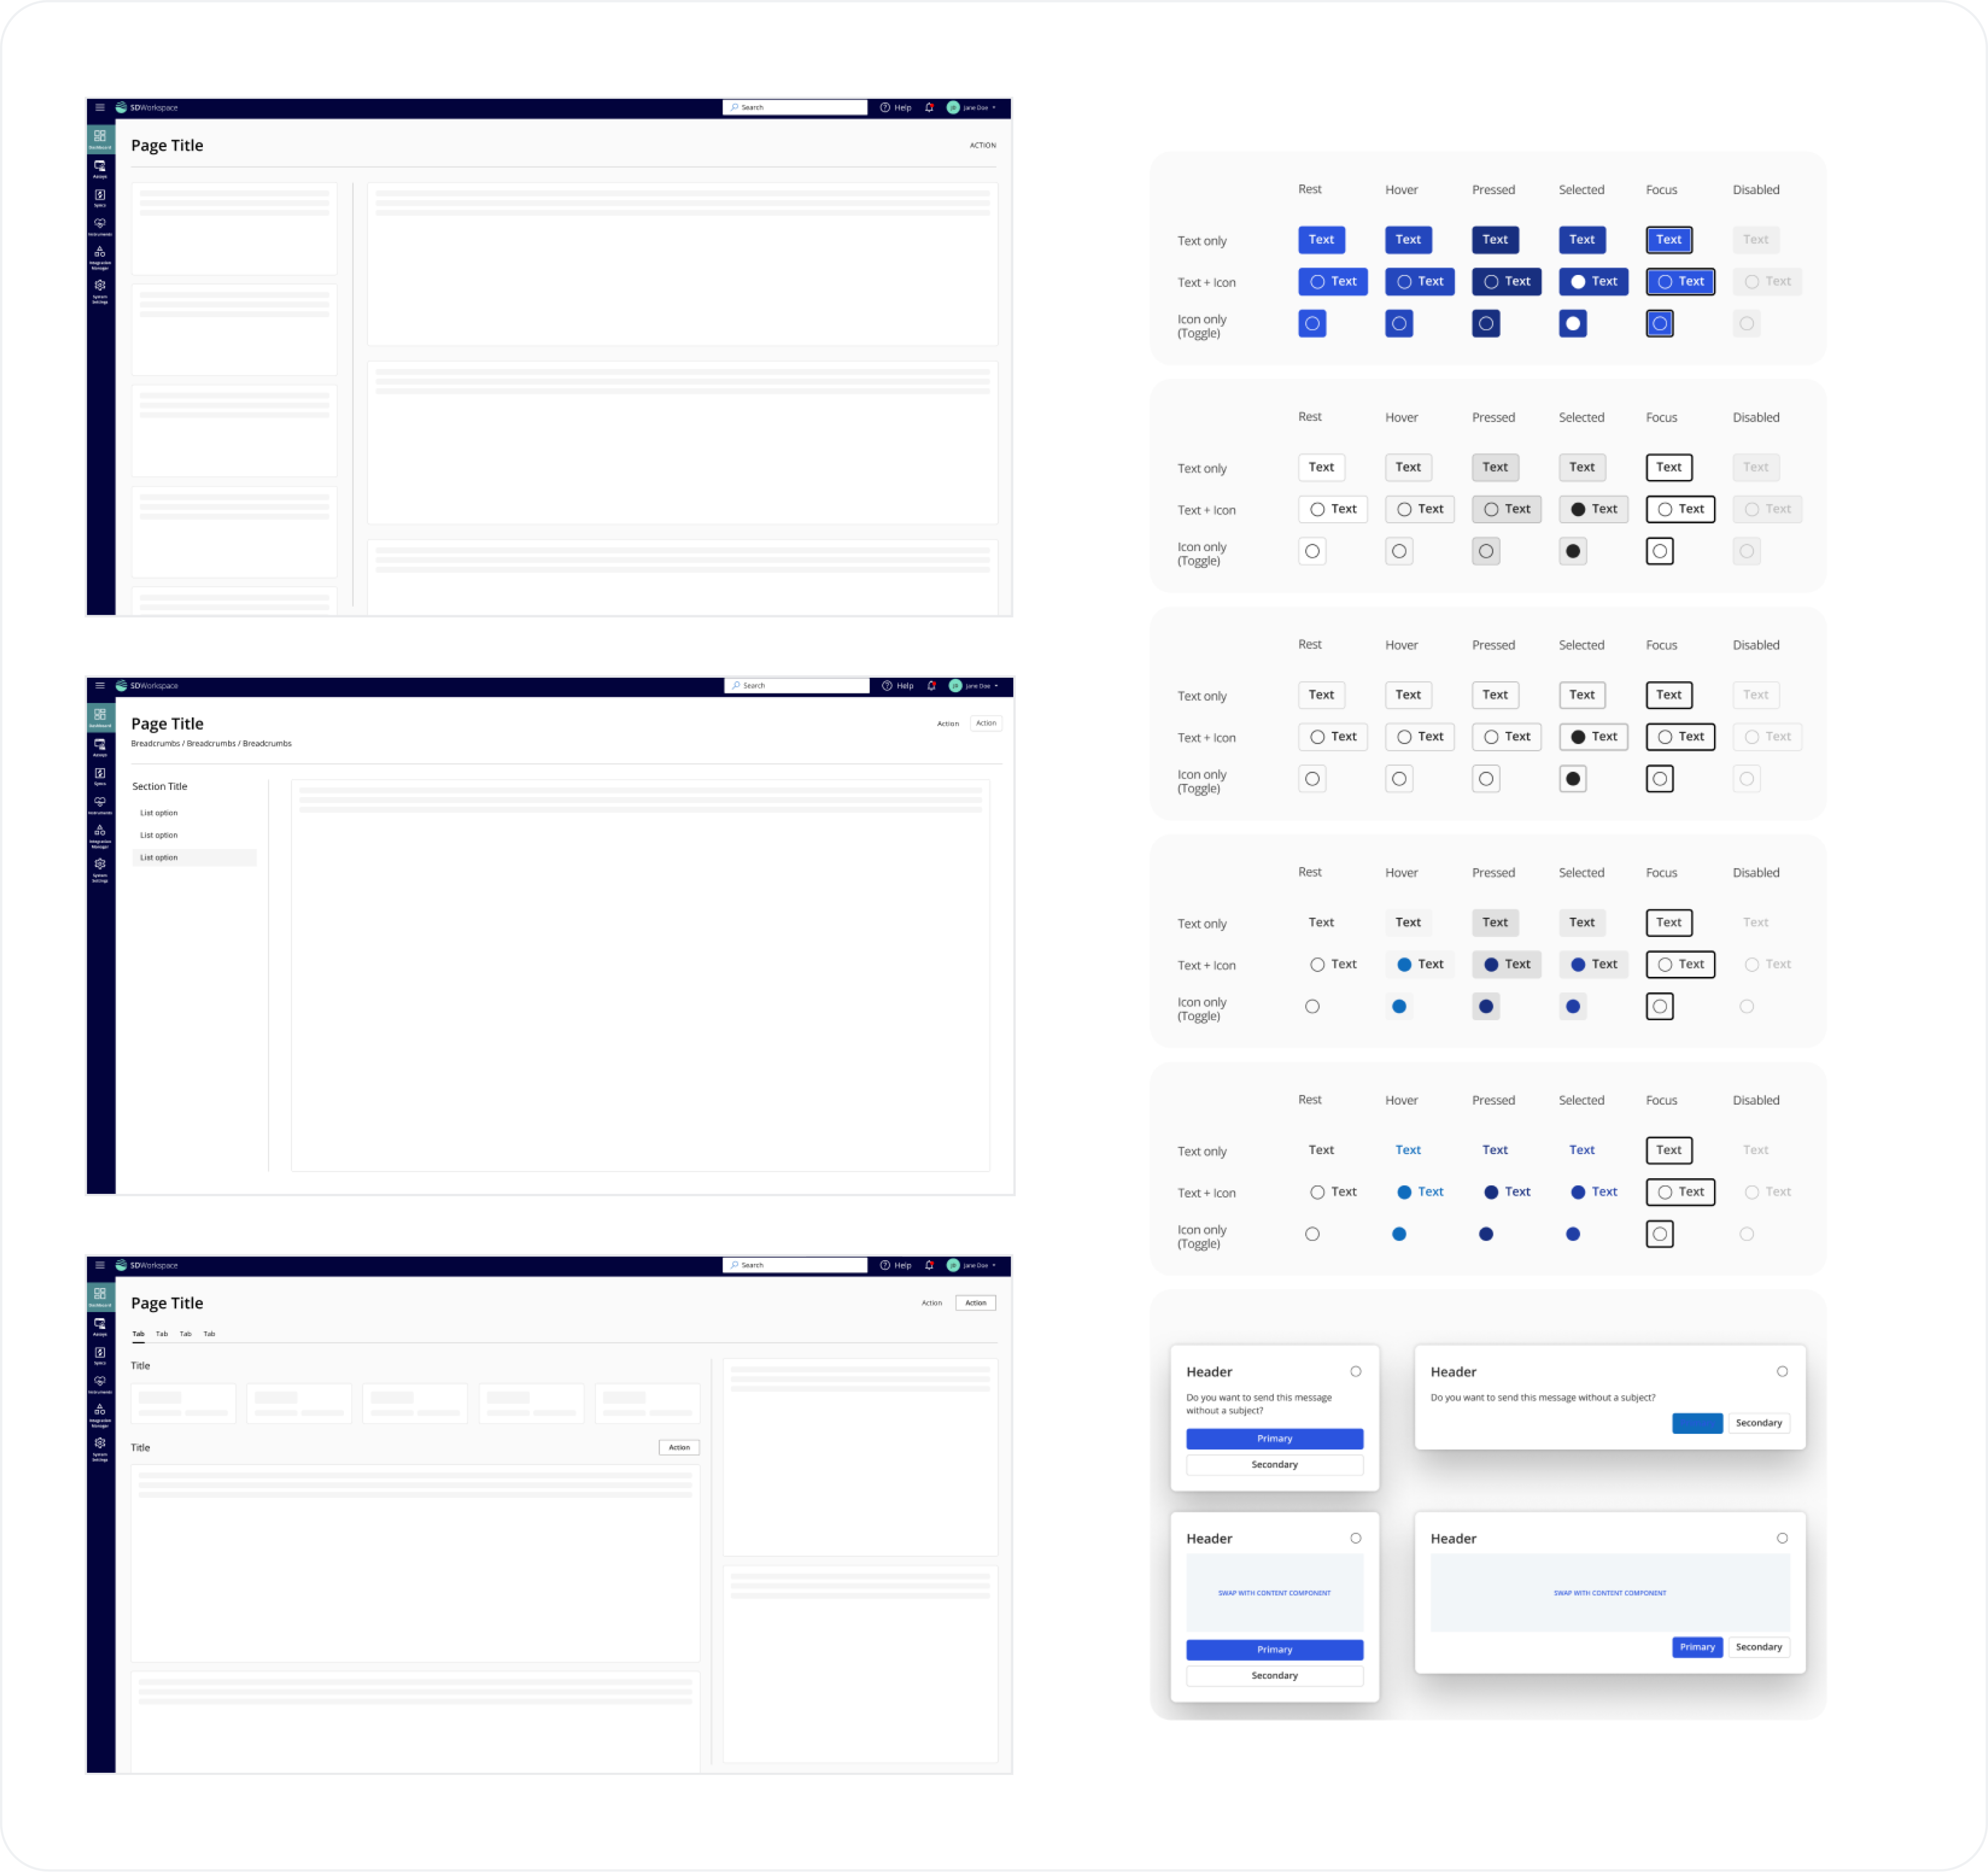
⬑ Components: Using Fluent UI as a starting point, we were able to utilize elements easily reusable for various layouts and screen types (dashboards, settings, etc.)
03 | Designing deliverables
I designed the project deliverables through an iterative process of gathering stakeholder and technical feedback on a weekly basis. Through this process, we were able to hand off flows that the client would be able to begin implementing for the entire Workspace and assay tool. Some key screens below:
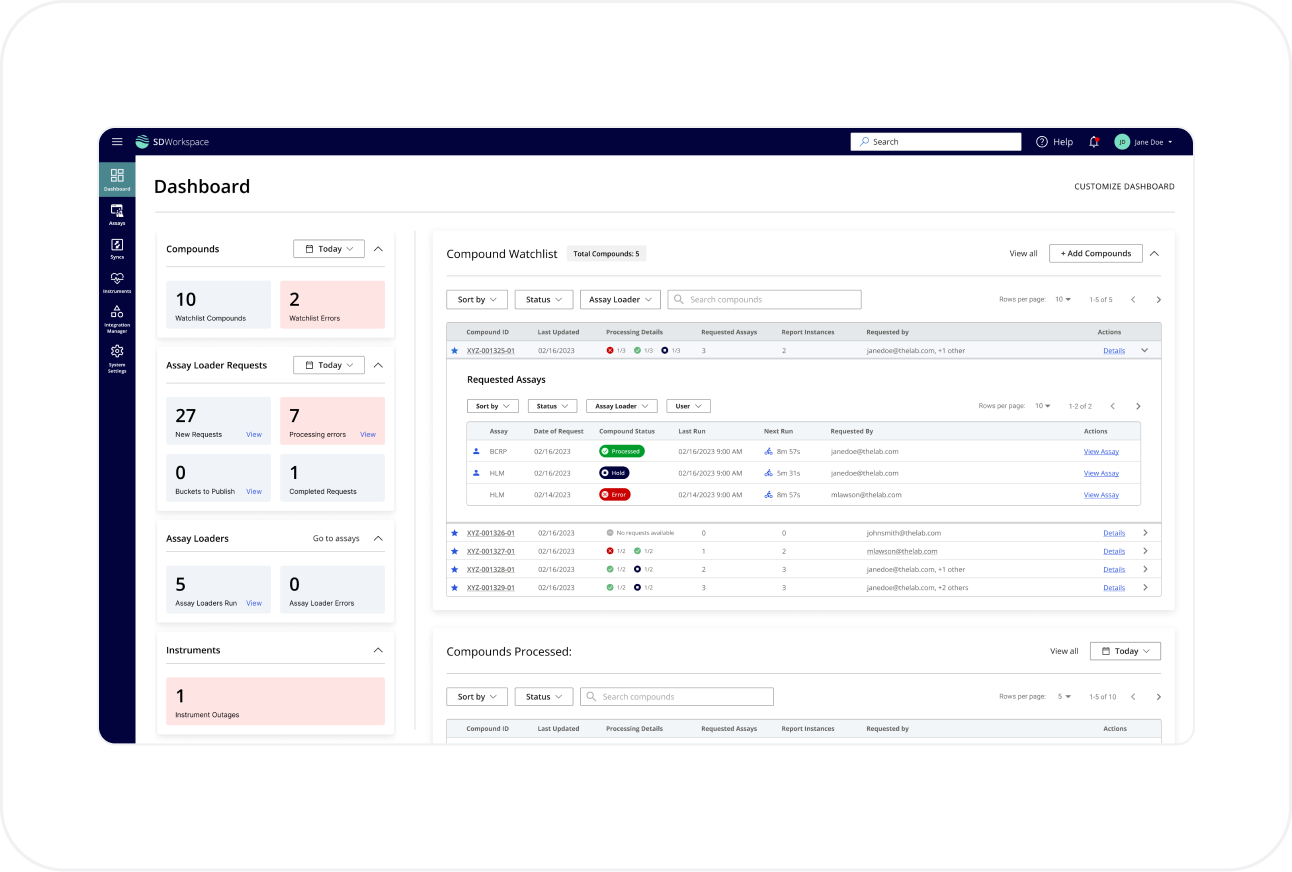
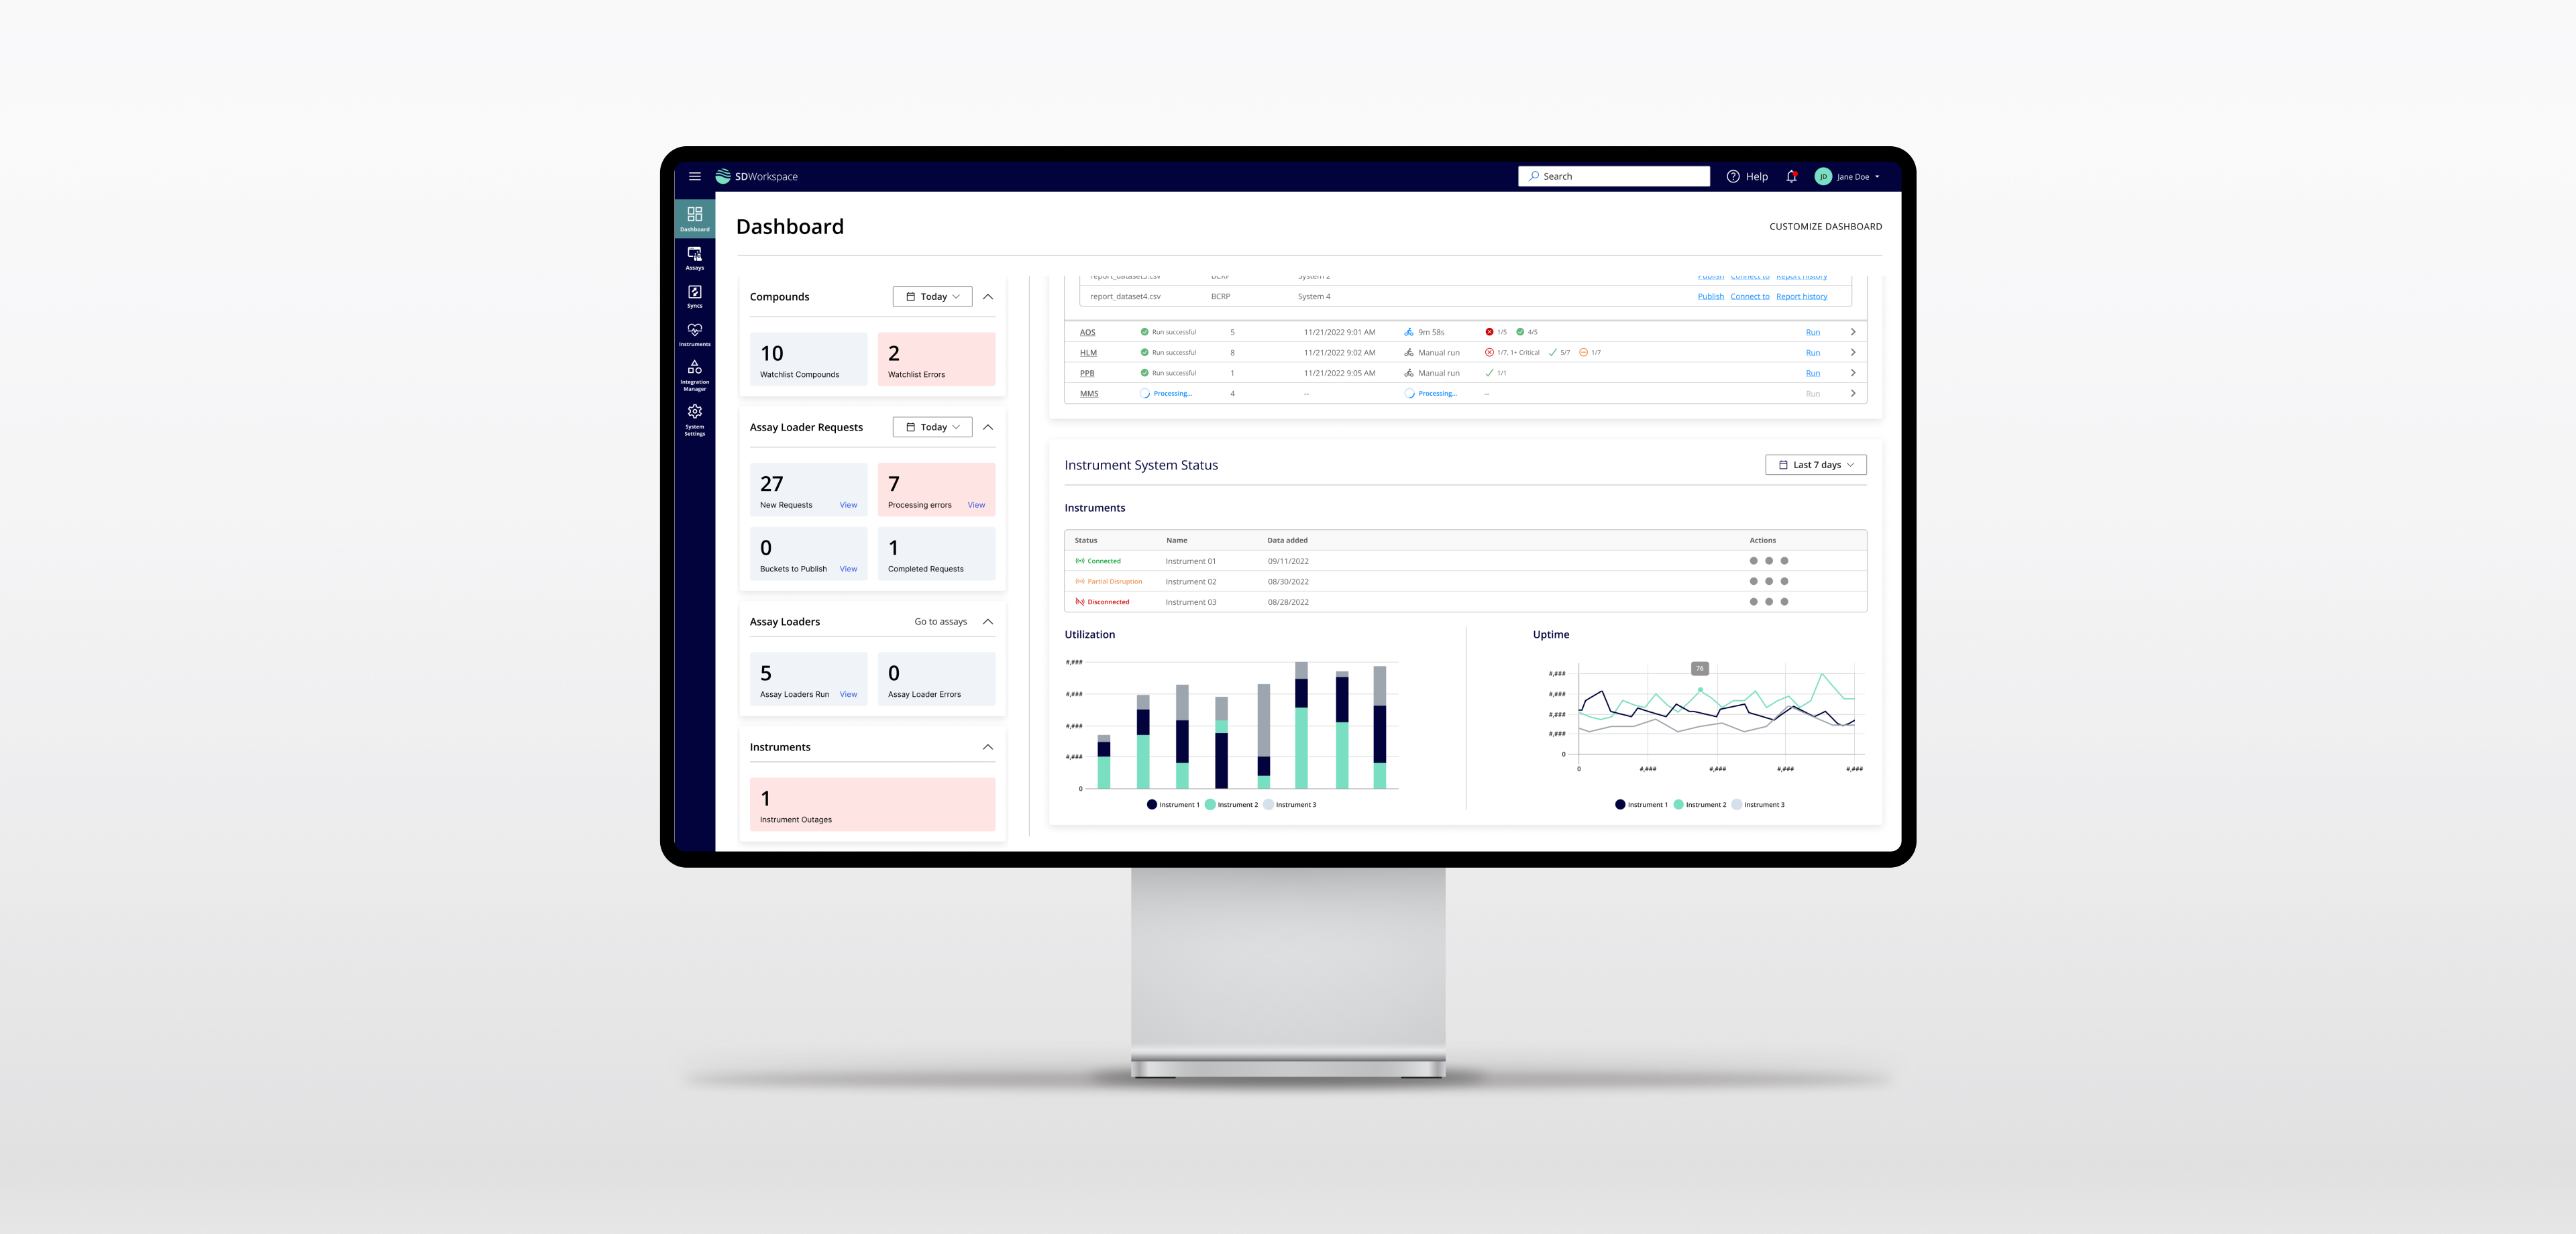
⬑ Dashboard: A customizable Workspace dashboard allows research teams to keep track of key data and metrics across their tools, including assay compounts.
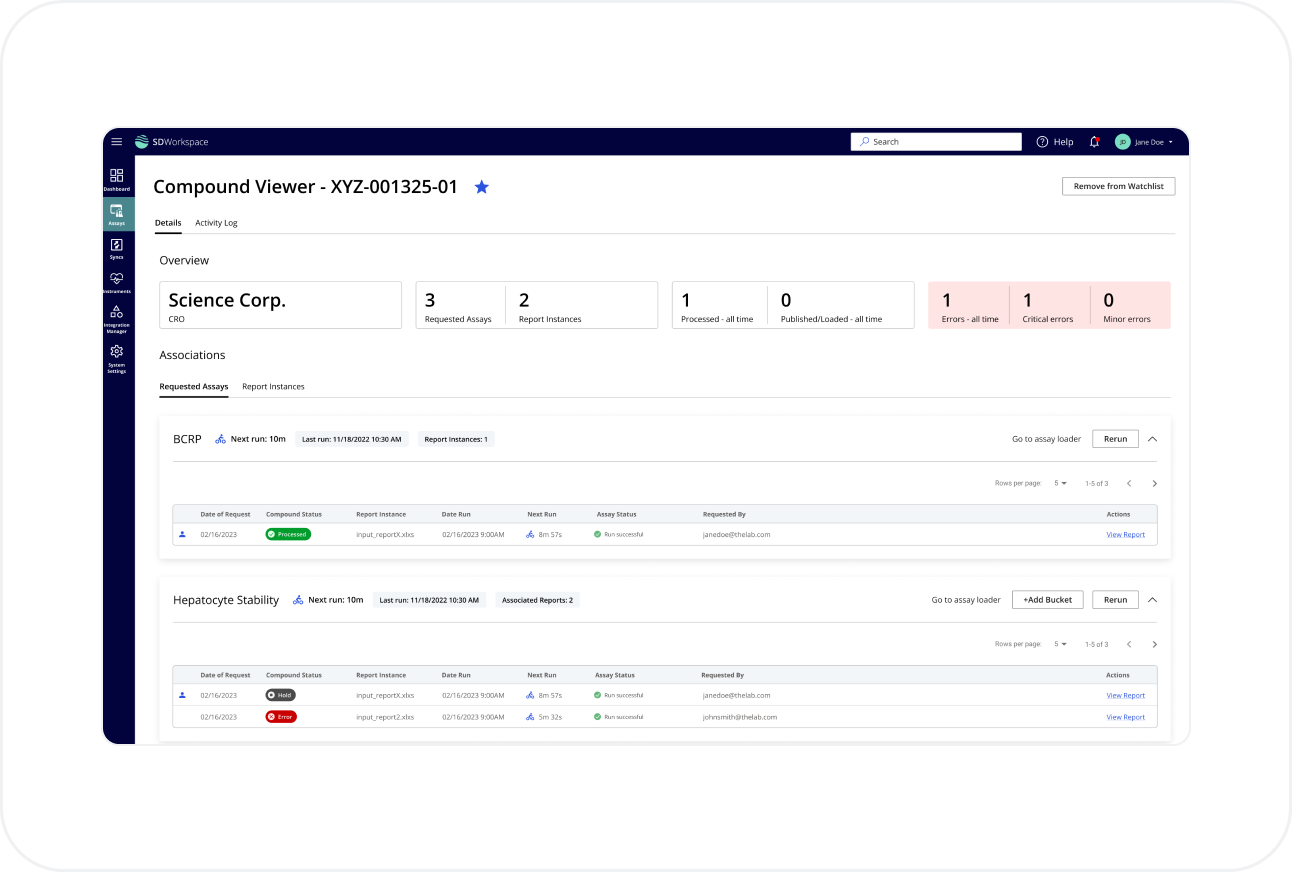
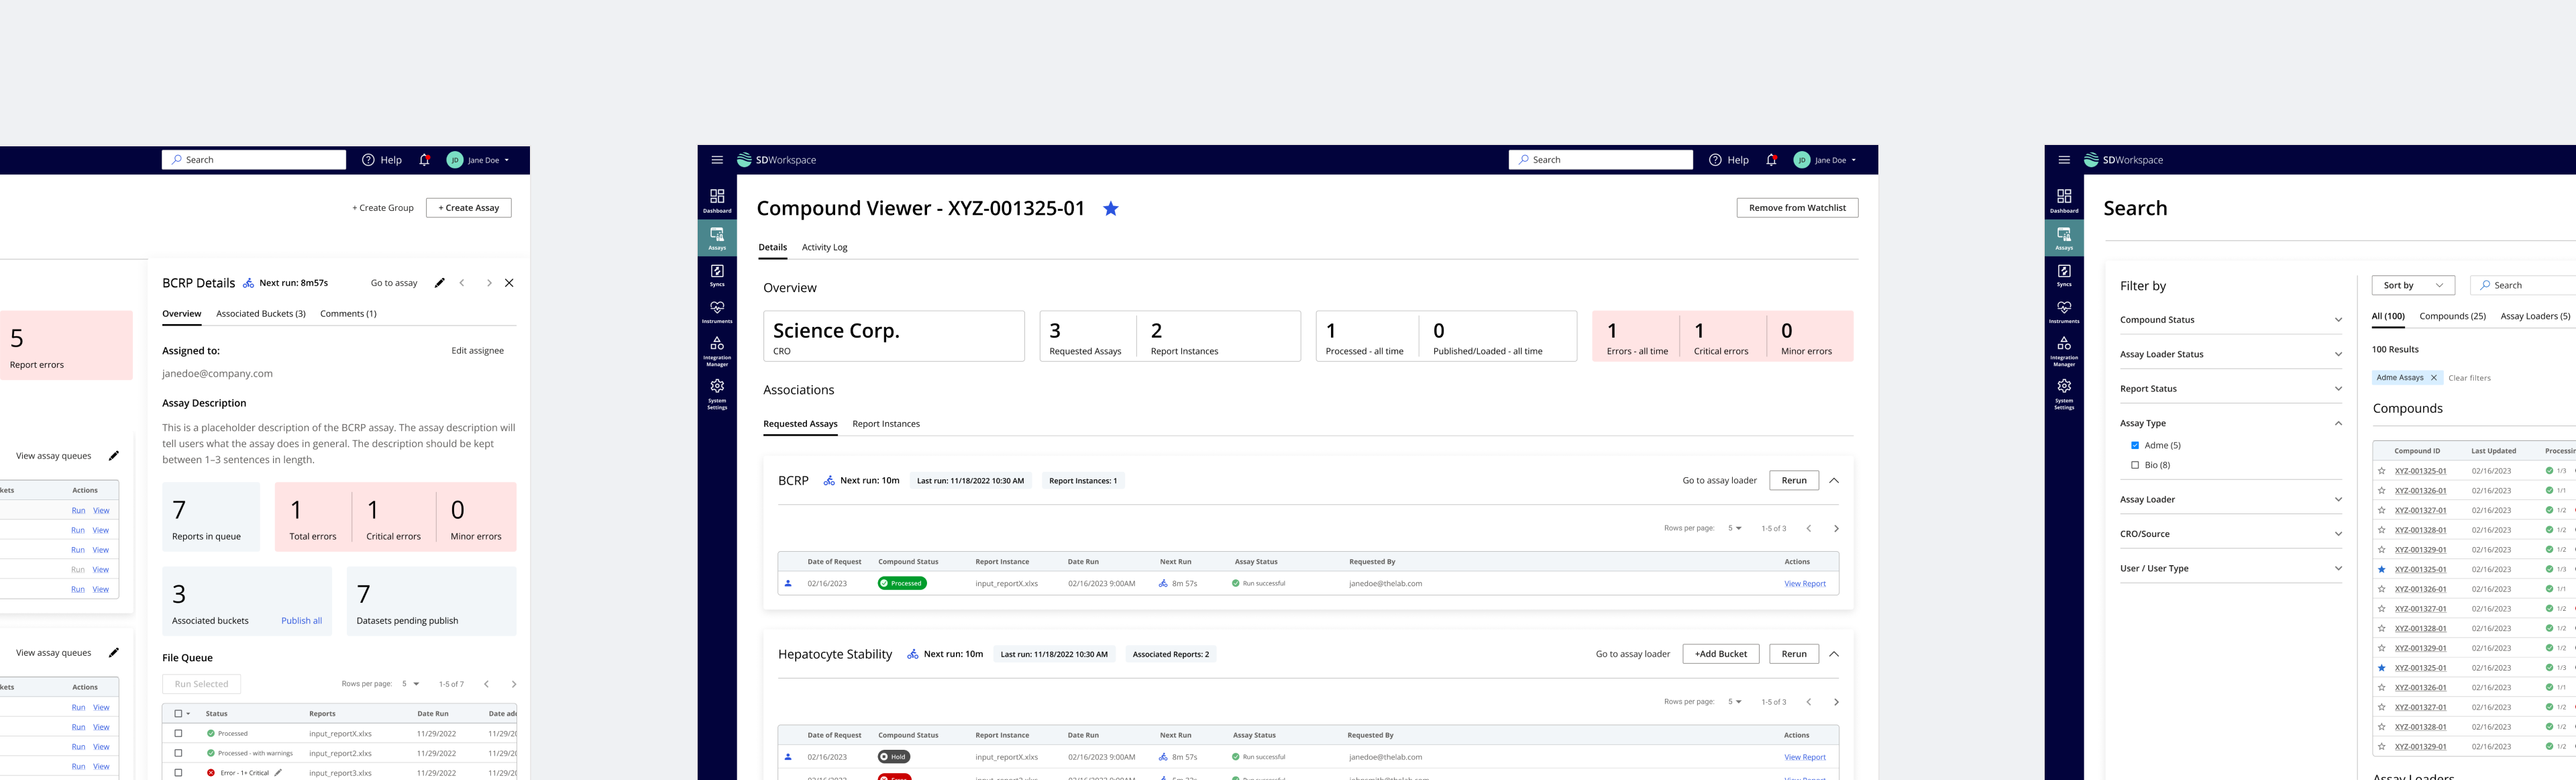
⬑ Individual Compound View: In the assay tool, users can view individual compounds to track their status across reports and associated assays.
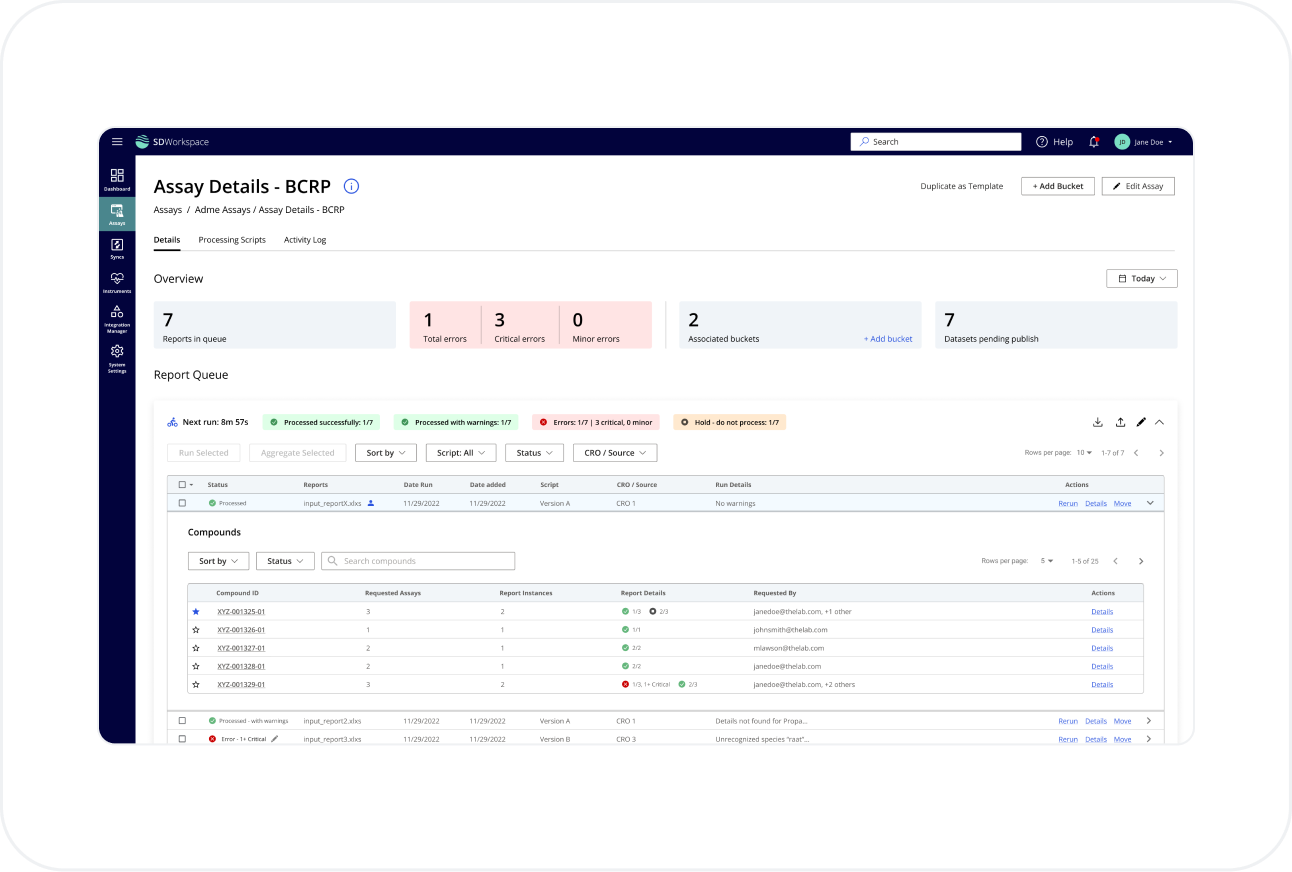
⬑ Individual Assay View: Users can view individual assays to see what reports are queued for processing and/or publishing; track errors; and troubleshoot processing code when needed.
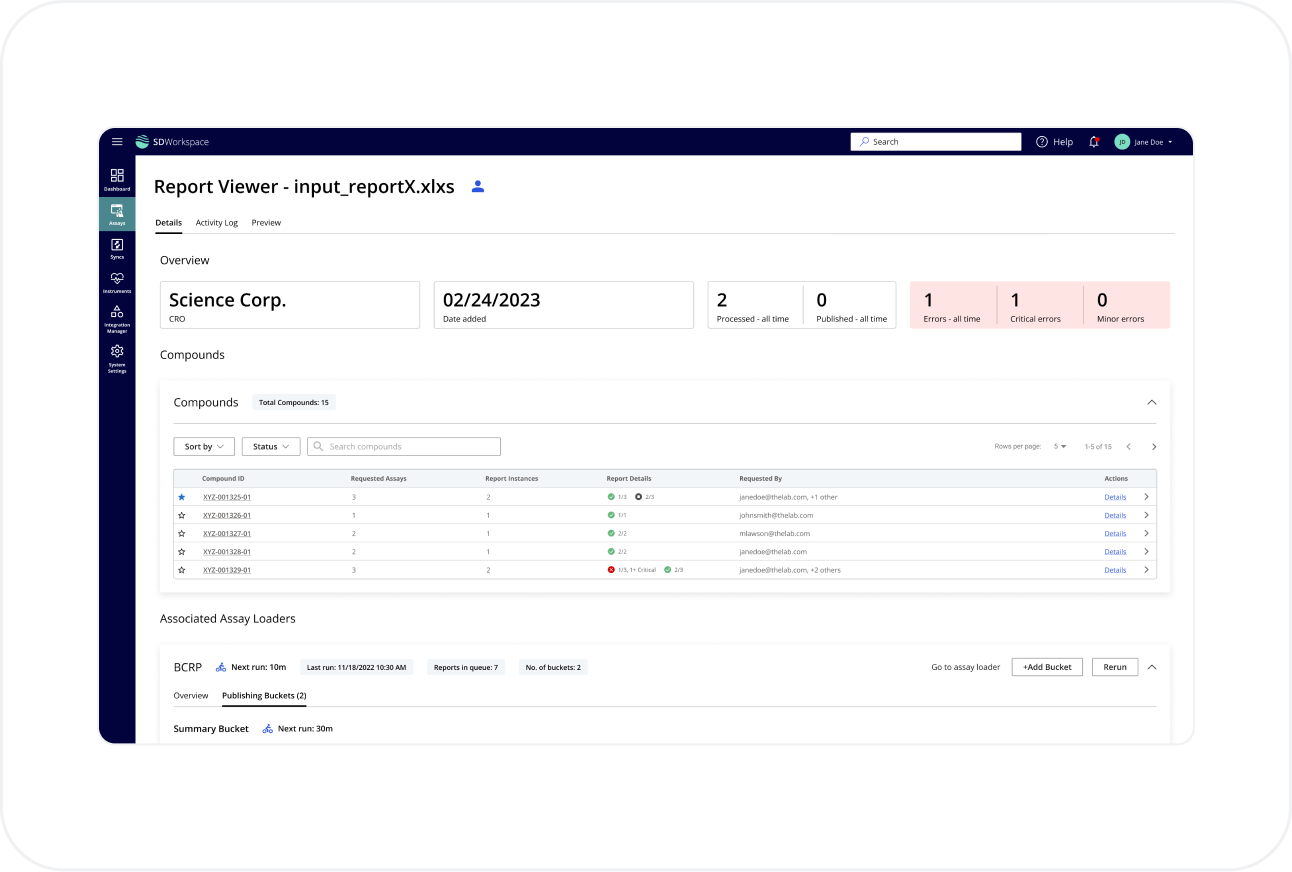
⬑ Report View: Individual reports can be viewed, and users can see what compounds exist in that report; what assays were requested for it; and which outputs are set for publishing.
Outcomes
- Research and designs delivered over the course of 6 weeks
- Medium-fidelity Figma prototypes, designs, and components delivered for implementation for MVP
- Customer-facing UI that will save research teams a large amount of time processing their data
- Ideas and next steps for designing future internal-facing UIs
